



Knowing the average on-time delivery rate and the average cost per shipment is not enough to understand whether distribution operations are efficient. A 94% on-time delivery rate may hide regions with flawless performance alongside others where one in five deliveries arrives late. Similarly, transportation costs that are in line with the budget may include areas where costs are twice the average.
The interactive Geoanalysis dashboard in B-AI Semplice displays deliveries, volumes, costs, and on-time performance across three connected maps: global, national, and local, down to individual delivery destinations.
This allows transportation managers to identify where margins are being lost and why.

UNDERSTANDING WHERE INTERNATIONAL TRANSPORTATION ACTIVITY IS CONCENTRATED
In the global view, the dashboard color-codes each country based on deliveries and volumes and displays the cost per kilometer, allowing countries to be compared on an equal-distance basis.
Two countries may receive similar shipment volumes but generate very different costs. Shipments to France may travel on fully loaded vehicles with scheduled departures, while those to Germany may cost 30% more per kilometer because they are split into separate trips or assigned to a carrier with higher rates.
The dashboard makes it possible to identify countries where transportation costs are increasing faster than shipment volumes. On these routes, managers can consolidate shipments, renegotiate rates, or organize backhauls to prevent vehicles from returning empty.
COMPARING ON-TIME PERFORMANCE AND COSTS REGION BY REGION
In the national view, the dashboard displays each region’s on-time delivery percentage alongside its average cost per delivery, highlighting areas that exceed targets in red.
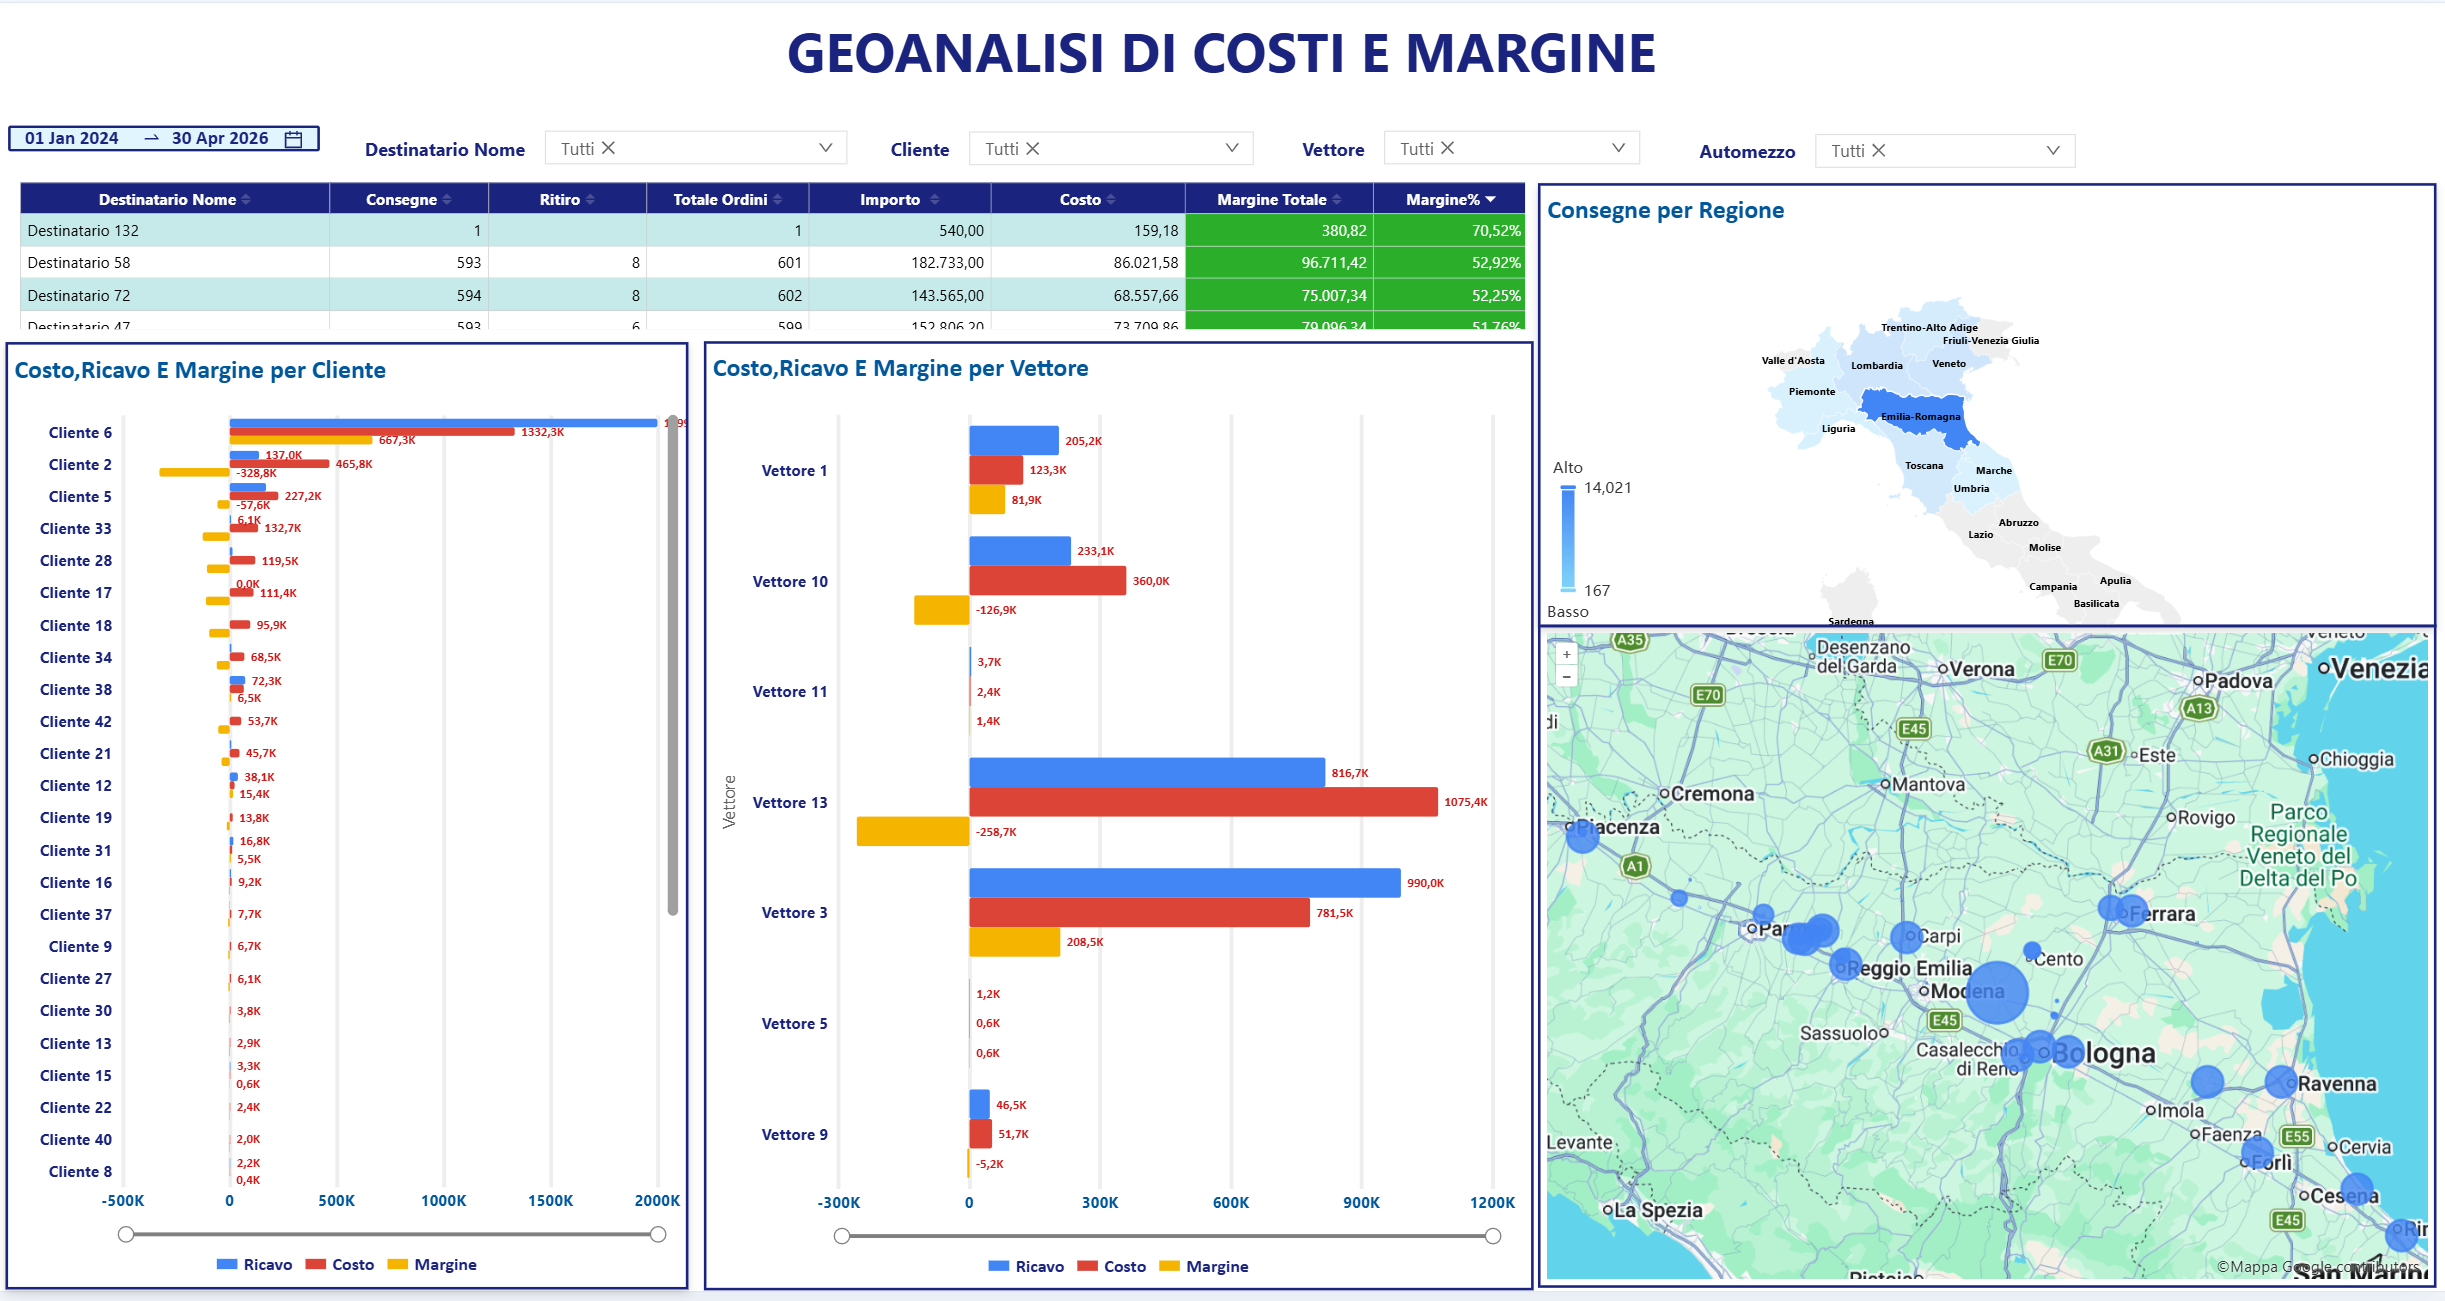
One region may have average transportation costs but poor on-time performance, while another may meet every delivery deadline at a cost significantly above target. In the first case, the problem concerns service reliability. In the second, it concerns financial sustainability.
Analyzing these two indicators together makes it possible to establish priorities, starting with regions that fall outside the acceptable thresholds for both. However, higher costs do not always indicate inefficiency, as islands and areas far from the warehouse naturally have higher structural transportation costs.
DRILLING DOWN TO INDIVIDUAL DELIVERY DESTINATIONS
The local view displays each delivery destination as a map pin, showing the number of pallets, weight, and volume delivered.
Two customers located just a few kilometers apart could be served on the same delivery route, yet they often receive their goods on different days or from different vehicles. Similarly, some areas have a high concentration of delivery destinations, while others require long journeys for only a few deliveries.
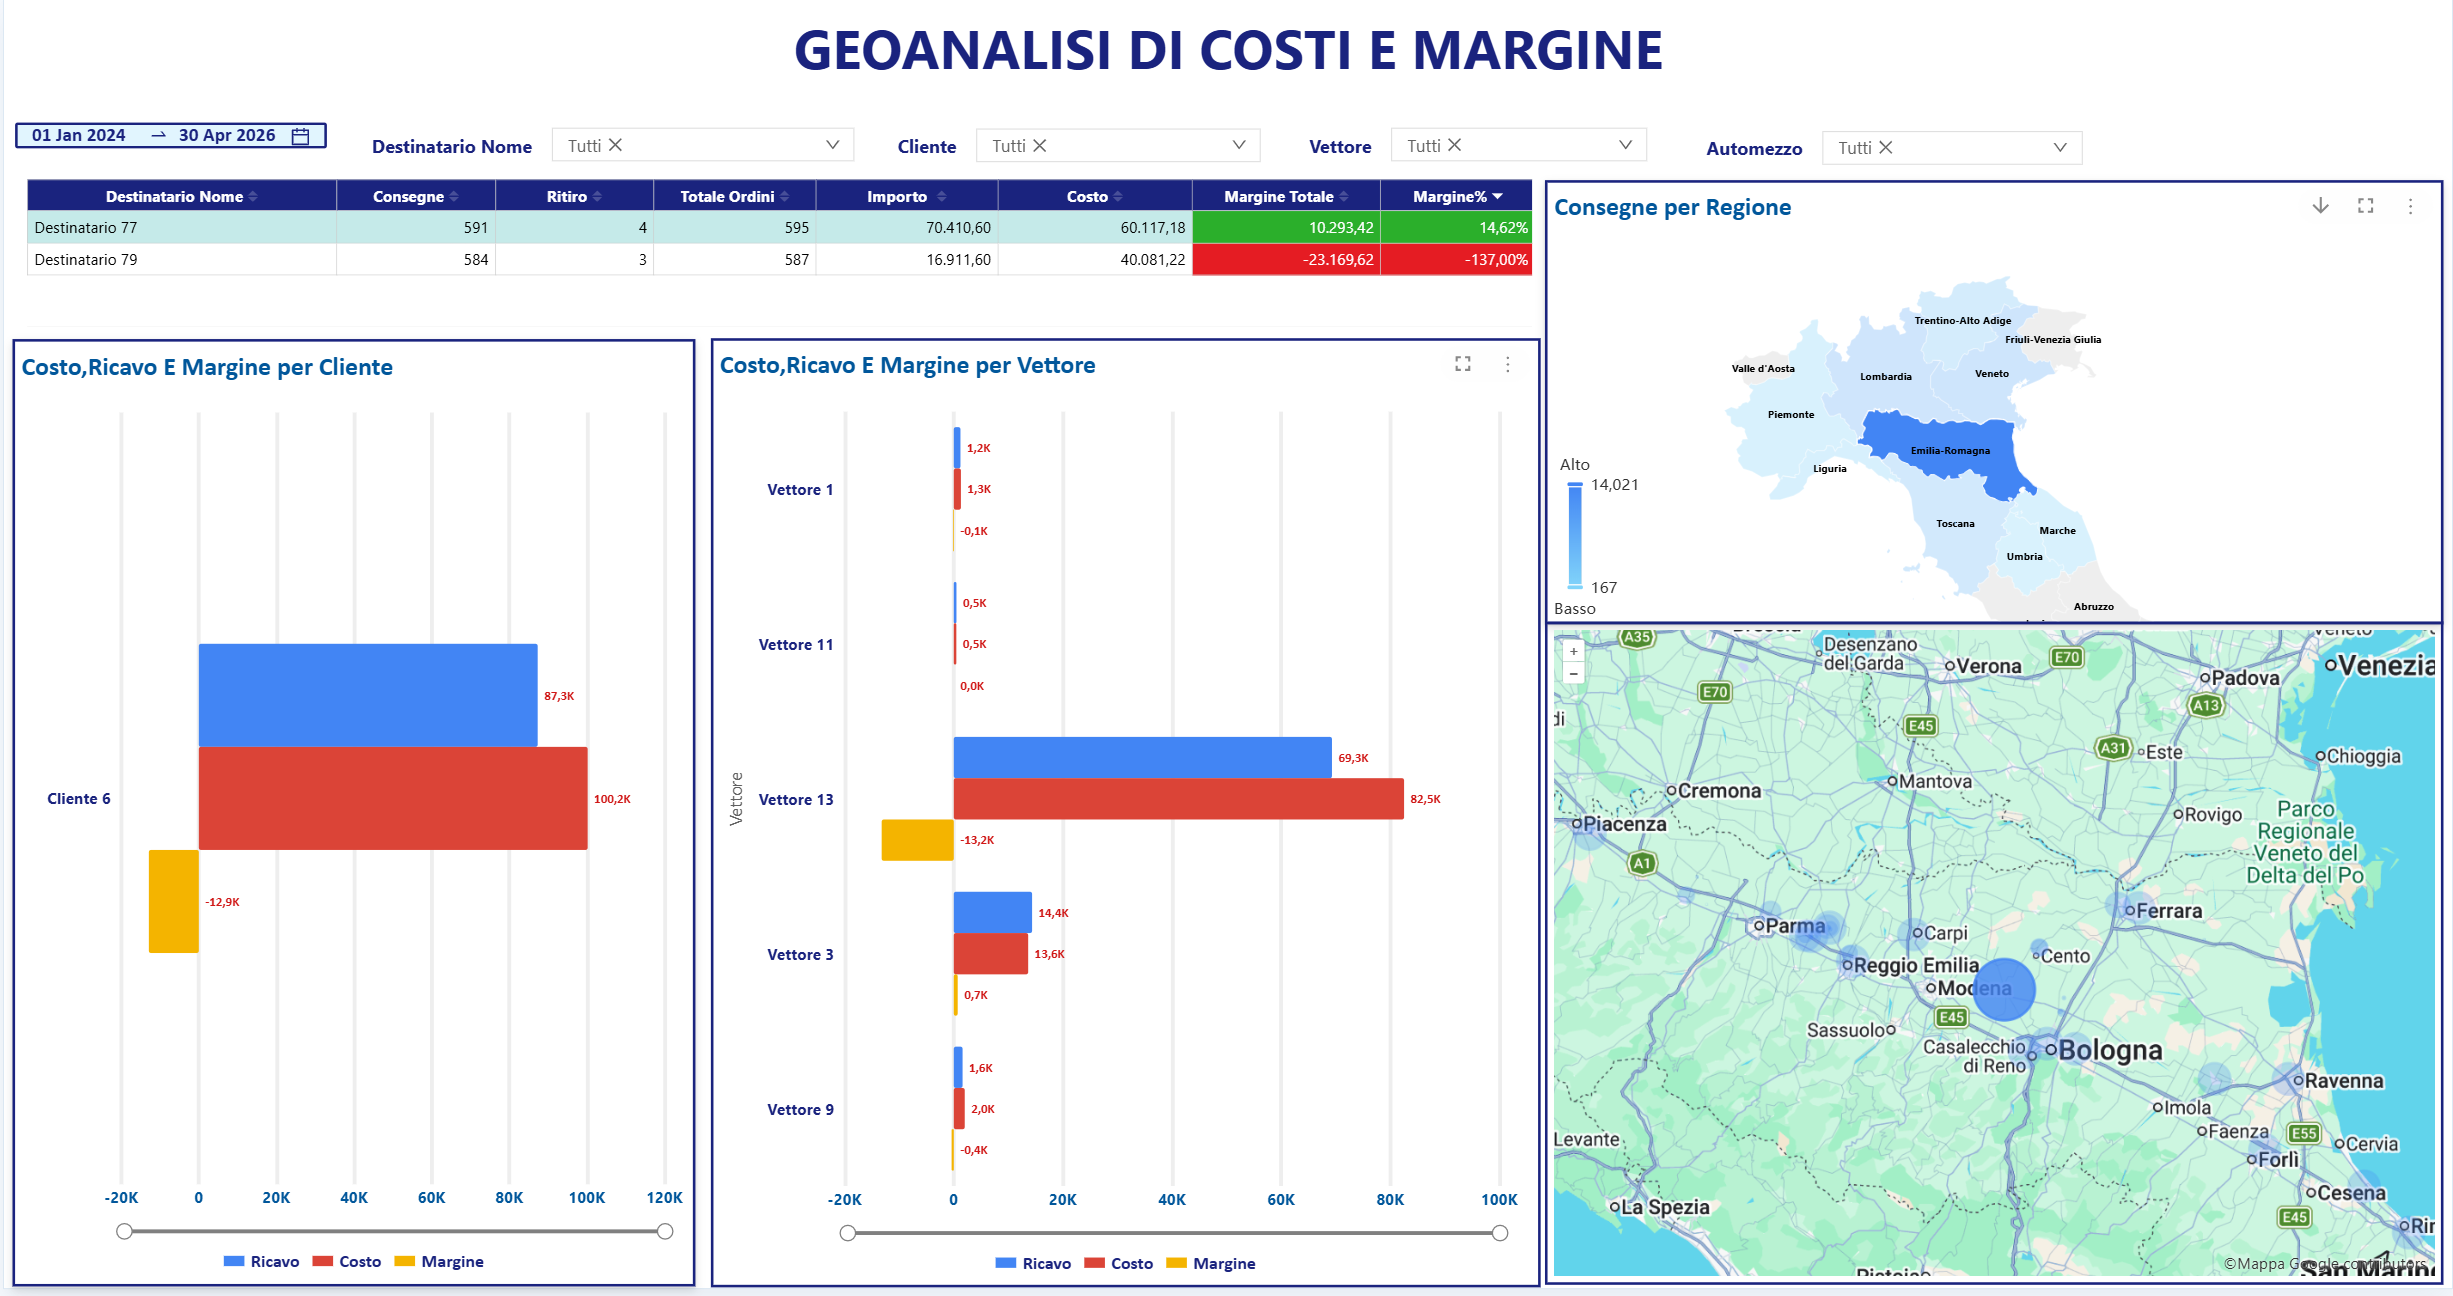
The dashboard makes it possible to identify these situations through the distribution of map pins and consolidate nearby delivery routes. Where an area has a high concentration of delivery points but remains highlighted in red, actual shipment volumes can help assess whether opening a mini-hub or drop-off point would be worthwhile.
FROM REGION TO ZIP CODE WITH SYNCHRONIZED MAPS
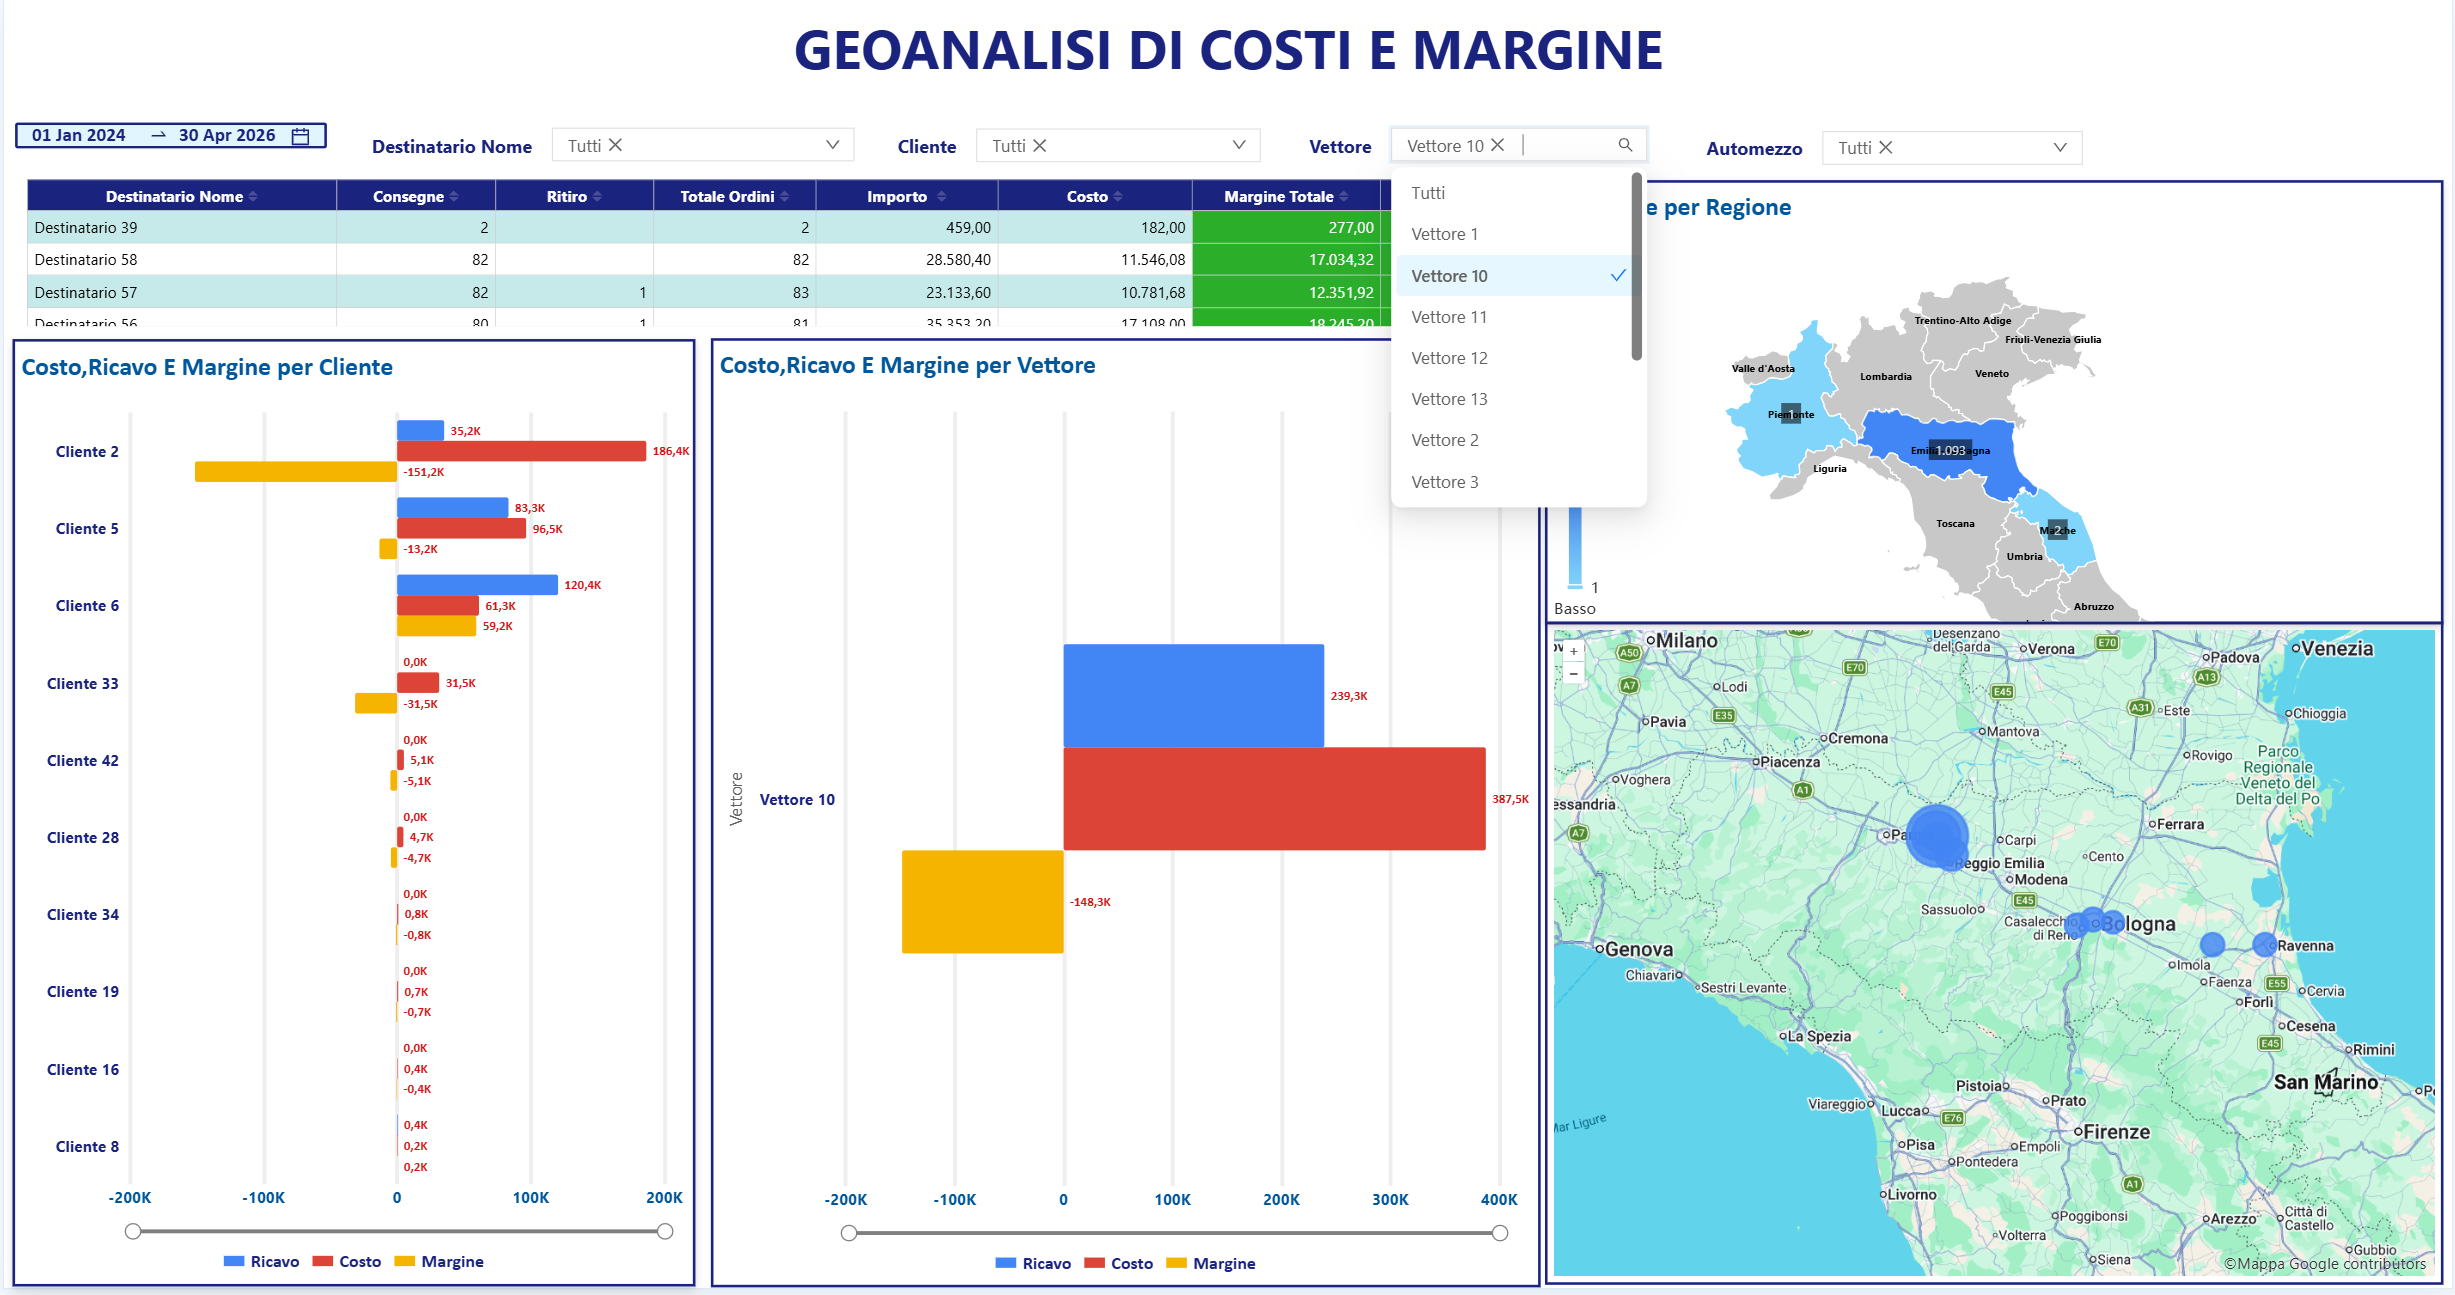
The three maps are connected. Clicking on a region automatically updates the local view to display only the delivery destinations within that area.
A region highlighted in red for poor on-time performance does not necessarily have a problem across its entire territory. Delays are often concentrated in just a few ZIP codes. In Lombardy, for example, they might affect only the metropolitan area served by vehicles departing around 5 PM and encountering rush-hour traffic.
With the dashboard, the problem can therefore be narrowed down from a regional issue to a local one. Moving the cut-off time earlier or reviewing pickup windows for those specific ZIP codes can increase successful first-attempt deliveries without changing the distribution strategy for the entire region.
FILTERING CARRIERS, LOCATIONS, AND DELAYS
Filters for location, carrier, and on-time performance narrow the map down to the information of interest. Selecting a carrier displays only the deliveries handled by that provider.
A carrier may provide reliable, on-time service across most of its assigned territory while consistently recording delays and above-average costs in just one small area.
The dashboard therefore makes it possible to evaluate carriers area by area and reassign only the problematic micro-area to a provider with a stronger local presence, without replacing a carrier that performs well almost everywhere else.
REVIEWING RATES AND SURCHARGES IN UNPROFITABLE AREAS
Some areas remain above cost targets even after optimizing delivery routes, carriers, and schedules due to distance, widely dispersed destinations, or accessibility challenges.
In these cases, the dashboard provides an objective basis for updating transportation rates and surcharges, introducing minimum order quantities, or agreeing on different delivery frequencies with customers.
QUERYING THE MAP WITH ARTIFICIAL INTELLIGENCE
The Geoanalysis dashboard can also be queried using natural language. Transportation managers can ask how much each kilometer served in Northern Italy costs or which carrier records the most delays in a specific province, receiving the answer as a KPI or chart.
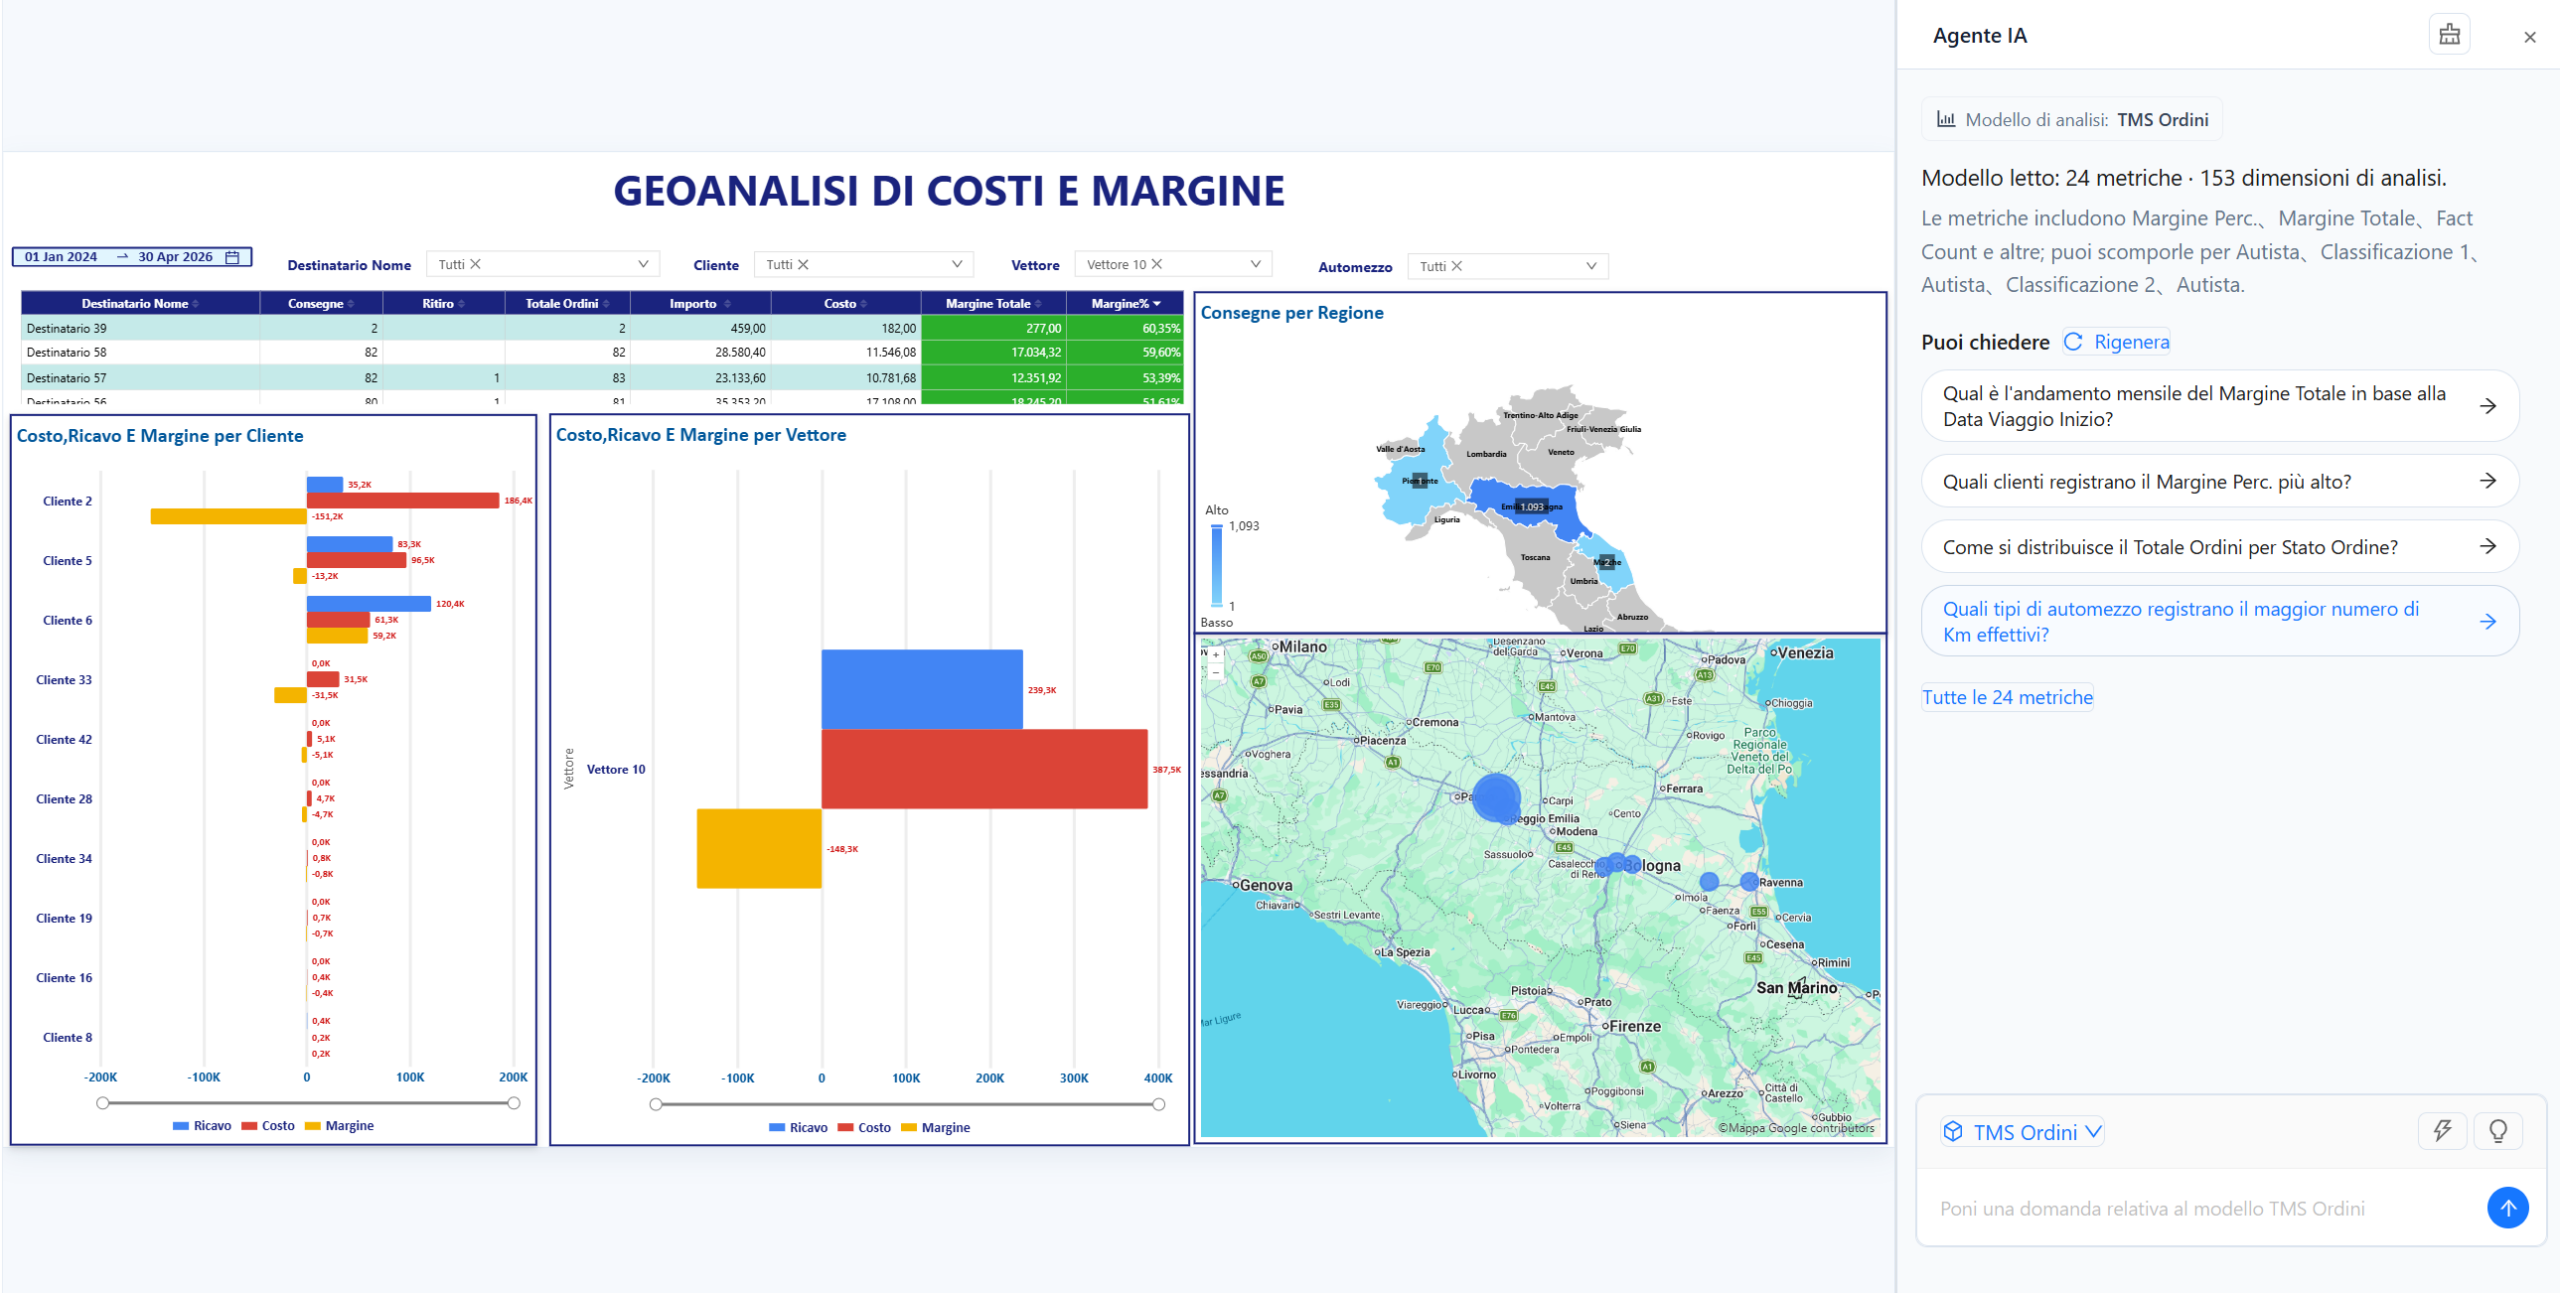
The AI Analyzer reads the dashboard data and highlights key findings, such as a region performing below target or a micro-area where on-time delivery performance is deteriorating, reducing the time needed to identify areas that require further investigation.
FROM MAPS TO OPERATIONAL DECISIONS
The Geoanalysis dashboard connects transportation costs and on-time performance to the geographical areas where they occur, making it possible to distinguish problems caused by carriers, schedules, or geography.
Based on this information, transportation managers can consolidate delivery routes, adjust cut-off times, reassign problematic micro-areas, and review rates for areas that are structurally unprofitable.
Because in distribution, margins are not lost in the national average. They are lost in a specific ZIP code.