


Strengths

Go live in just a few days
Fast and stress-free implementation
No months-long projects required. You’ll be up and running quickly, without disrupting processes and without the need for an internal IT team.

Intuitive Artificial Intelligence
Ask in natural language,
give voice to your data.
You can query your data with natural language questions. The AI gives you clear answers, charts, and actionable insights.

Ready-to-use KPIs for your industry
Operational dashboards from day one
You don’t start from an empty platform. You immediately get dashboards and indicators designed for Supply Chain, built on nearly 40 years of experience in the field.

Clear and predictable pricing
A transparent annual fee
No hidden costs! Choose a tailored package, always knowing exactly how much you spend and what you get.

Secure and scalable cloud
Your data, always safe.
Your data is hosted on IBM infrastructure with the highest security standards and the flexibility to grow alongside your business.

Simona R., CEO, impresa manifatturiera
Simona R., CEO, impresa manifatturiera
Con l’AI di B-AI Semplice, posso chiedere qualsiasi cosa alla mia azienda come se parlassi con il mio controller. Ma lui non è sempre disponibile. L’AI sì.
Simona R., CEO, impresa manifatturiera
Con l’AI di B-AI Semplice, posso chiedere qualsiasi cosa alla mia azienda come se parlassi con il mio controller. Ma lui non è sempre disponibile. L’AI sì.
Simona R., CEO, impresa manifatturiera
Con l’AI di B-AI Semplice, posso chiedere qualsiasi cosa alla mia azienda come se parlassi con il mio controller. Ma lui non è sempre disponibile. L’AI sì.
Simona R., CEO, impresa manifatturiera
Con l’AI di B-AI Semplice, posso chiedere qualsiasi cosa alla mia azienda come se parlassi con il mio controller. Ma lui non è sempre disponibile. L’AI sì.
Simona R., CEO, impresa manifatturiera
Con l’AI di B-AI Semplice, posso chiedere qualsiasi cosa alla mia azienda come se parlassi con il mio controller. Ma lui non è sempre disponibile. L’AI sì.
Blog
Read All
14 October 2026
GEOANALYSIS, FINDING THE ZIP CODES WHERE TRANSPORTATION IS ERODING MARGINS
Knowing the average on-time delivery rate and the average cost per shipment is not enough to understand whether distribution operations are efficient. A 94% on-time delivery rate may hide regions with flawless performance alongside others where one in five deliveries arrives late. Similarly, transportation costs that are in line with the budget may include areas […]
28 September 2026
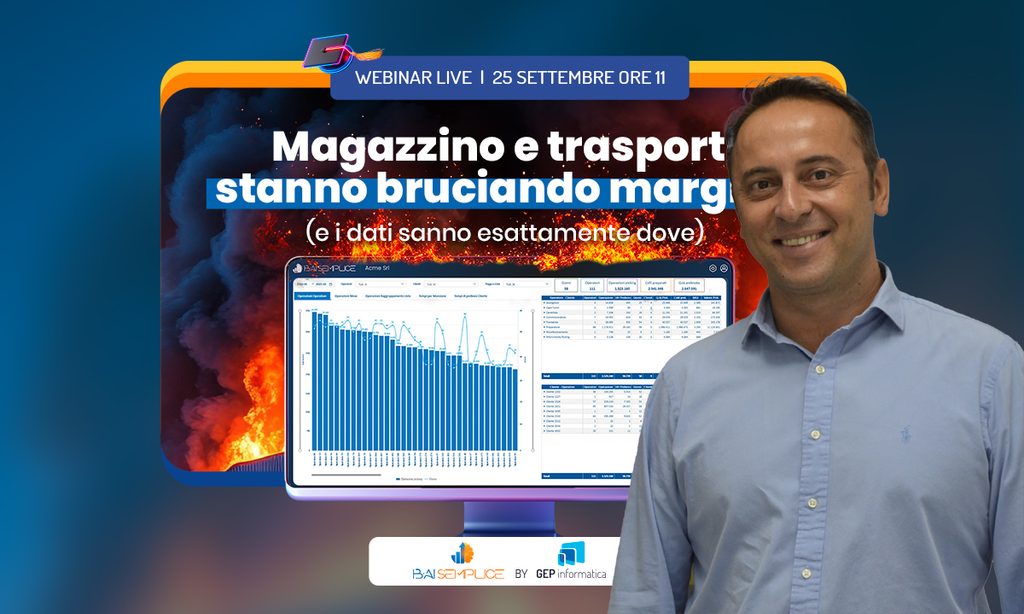
Why Does Logistics Respond Too Late? Watch the Webinar Again
How Much Is It Costing Us? Anyone who manages a warehouse or organizes transportation will eventually be asked the same question, whether during a meeting or in an email from management. How much is this customer, this route, or this department costing us? It sounds like a simple question, but providing an accurate figure is […]
21 September 2026
Warehouse Capacity Utilization, Understanding Where Space Is Really Running Out
Knowing that a warehouse is 70% full is useful, but it is not enough to make informed decisions. That percentage does not show which areas are under pressure, which products are taking up the most capacity, or whether the available space is being used efficiently. The B-AI Semplice Capacity Utilization dashboard makes it possible to […]
Con l’AI di B-AI Semplice, posso chiedere qualsiasi cosa alla mia azienda come se parlassi con il mio controller. Ma lui non è sempre disponibile. L’AI sì.